How I Fixed Handy's Memory Leak Without Knowing Rust
FIGURE 1 ⋅ How I Fixed Handy's Memory Leak Without Knowing Rust
For the TikTok attention span ("TL;DR")
I applied The Framework to diagnose and fix a nasty memory leak in the wonderful Handy voice transcription app. This required some novel adaptations of The Framework that Software and AI Engineers alike will appreciate.
Developed and implemented an agent autonomy harness so that my AI agents could run Handy end-to-end without interrupting my work (this was massive)
Instrumented the Handy runtime for observability and agent sensory feedback (also massive)
Used this instrumentation to analyze and narrow systematically to isolate the source of the leak
Fixed the leak in 3 ways, and tested each bit of the fix on its own, and together, measuring how each contributed (one of the candidate fixes was dropped after seeing its minimal contribution)
Deployed adversarial agents to scrutinize findings
Surfaced a patched version of the app for me to run for days to prove, via additional telemetry, that the fix worked (the important meatbag-in-the-loop bit)
All of this was done in a completely reversible way, leaving no trace of the Rust development environment on my machine after successfully diagnosing and fixing the memory leak.
This is what AI-accelerated software engineering looks like when it's not "vibe coding" 🤮.
Have you tried Handy for voice transcription?
If not, get some! I really dig it. Voice transcription has been my primary input device (measured by characters input) for over a year now. I wrote my own for use in WSL, before I ditched Windoze forever. I've even deployed the most controversial keyboard in the world to charactermaxxx with it.
The problem was that Handy contained a devastating memory leak that rocked my beloved Linux box, blasting my productivity with a system-shattering OOM kill that disrupted my work severely. After recovering, I decided to be a good open source citizen and figure out WTF had caused this, file a bug report, and attempt to fix it.
I'm not a Rust programmer though ...
Handy is a Tauri app -- a kind of clever spin on the Electron concept of building web applications that run everywhere. It's a Rust backend with a React frontend and, thanks to Tauri, instead of shipping an entire browser engine (vis Electron + Chromium) it borrows the already-installed browser. Neat!
That said ... I known't Rust. Whatever shall I do?
I heard a strange, humming sound from my Ghostty terminal ...
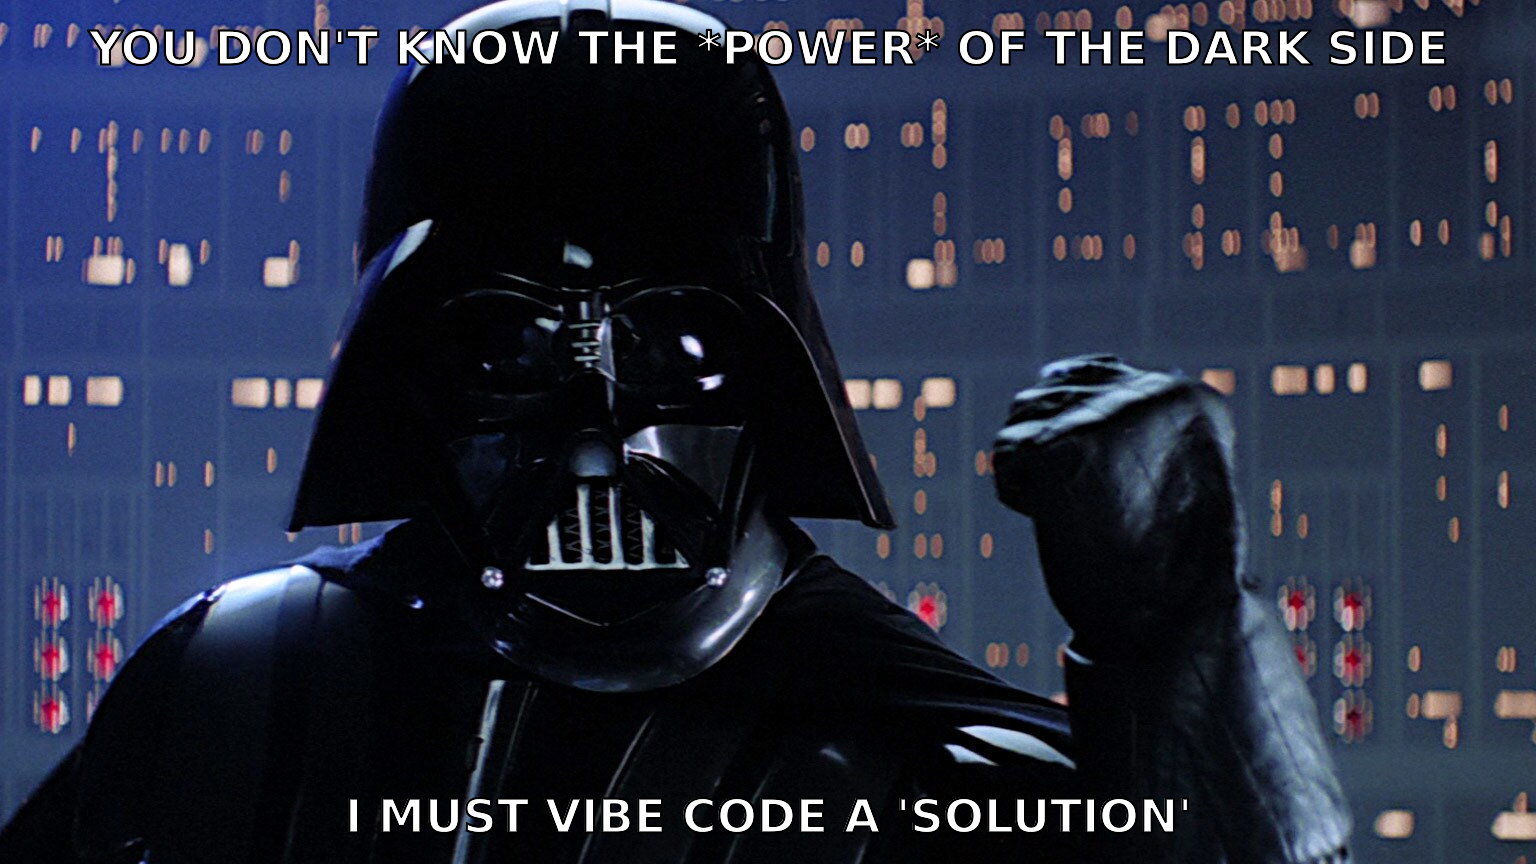
An off-the-shelf installation of Claude Code was buzzing with the urge to vibe slop a purported solution!
FIGURE 2 ⋅ You don't know the **power** of the dark side ...
That simply would not do, though. The Vibe Coding Hangover is, as we all know, quite real.
Plus, I couldn't responsibly vomit slop into someone else's repo, especially not for a tool that I use daily. This remained a software engineering problem.
Adapt and apply The Framework.
Okay, so what is this ✌️"The Framework"✌️?
I'm so relieved that you asked! The Framework is the engineering discipline I've built for using AI coding agents to ship real software -- production stuff, not throwaway demos. I first presented it as a talk at the AI Engineer Summit: The Cure for the Vibe Coding Hangover. The seminal essay is forthcoming -- I'm working through it now -- but the talk is the public version for the time being.
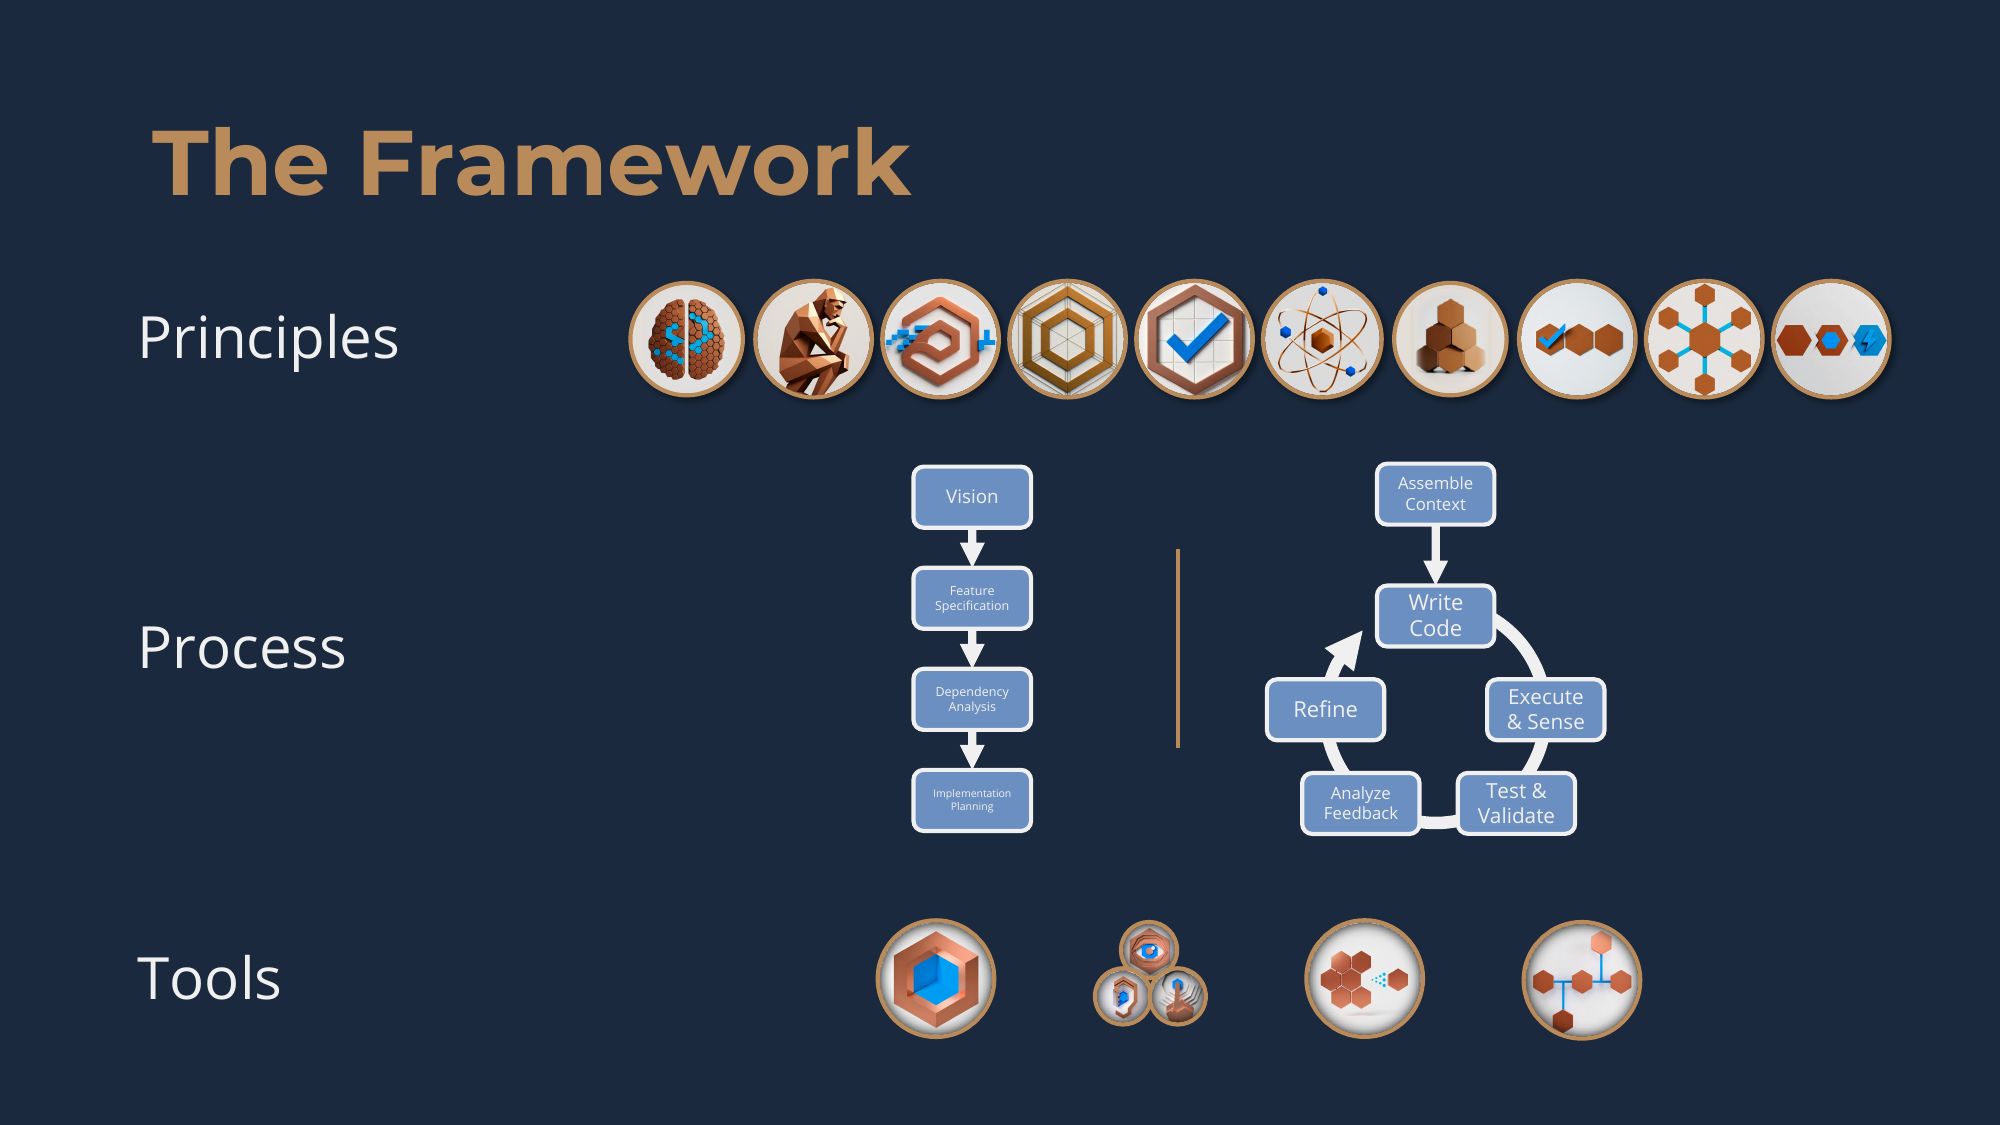
FIGURE 3 ⋅ The Framework
Three components, all interlocking:
Principles -- the philosophy. You are the architect, the agent is the implementer.Specify, don't prompt.Define done before building.Reduce until irreducible. Ten of these in total, each a pithy aphorism that makes "the gospel" of it easy to remember.
Process -- two phases that translate the philosophy into work. The Planning Phase is where you do the architectural thinking: vision, features, specifications, dependencies, plan. The Implementation Loop is where the agent takes those specifications and turns them into working code. Planning produces artifacts; the loop spins on them.
Tools -- a coding environment, version control, context engineering, and the Multi-Sensory Feedback System. The agent observes its own work through three "digital senses" -- Visual (what renders), Auditory (what the logs report), Tactile (how the thing responds when you actually use it). Tests give the agent a pass/fail verdict; the senses tell the agent why something is or isn't working. Done means tests pass AND all senses report clean. Both, not either.
🍸 Sound Smart at Cocktail Parties:
"The Multi-Sensory Feedback System closes the diagnostic loop between formal verification and qualitative observation."
That's The Framework, and it works masterfully when building new software. It works just as well when applying it to existing software that wasn't developed using the methodology, with some adaptation.
Right, so what did that adaptation actually look like?
The Framework is built for writing new software from scratch -- but this wasn't that. I was parachuting into someone else's Rust codebase without a map, without knowledge of the language, and chasing a bug that only shows its face after many hours of use. This was classic hard-bug territory, and the agents couldn't just write some tests and check the senses -- there were no "memory leaks" tests, no observability, and you can't curl your way into a voice transcription cycle.
1. The autonomy harness
My AI agents had to be able to run the app. Handy is a desktop app triggered by a global keyboard shortcut -- without a way for the agents to spin it up, inject audio, trigger recording cycles, and measure what happened, all autonomously, every experiment would have needed me to sit there mashing keys for 30-minute stretches, doing nothing else. That's very costly digital babysitting. So I built the agents their own little sandbox:
a dedicated Xvfb display so they weren't fighting me for screen real estate
a PipeWire null sink piping deterministic test audio through paplay so they could actually speak into Handy's microphone (that's right -- my AI agents speak into my microphone ... do yours not?)
a SIGUSR2 trigger to start recordings without spawning a second Handy instance and polluting the trace
All of this plus full reversibility: snapshot the system, install the tooling, do the work, diff-based uninstall, verify the system's back to baseline. Tear the whole rig down with no trace afterward.
flowchart LR
    subgraph WS["My workstation"]
        Me["Me, working normally<br/>(unaffected)"]
    end

    Agent(("AI agent"))

    subgraph Sandbox["Agent's sandbox (isolated)"]
        direction TB
        Audio["test_audio.wav<br/>→ paplay<br/>→ PipeWire null sink"]
        Trigger["SIGUSR2 trigger"]
        Handy["Instrumented Handy<br /> (see below)"]
        Display["Xvfb virtual display"]
        Audio -->|mic input| Handy
        Trigger -->|start/stop recording| Handy
        Handy --> Display
    end

    Agent -->|drives| Sandbox
The autonomy harness: agent drives Handy end-to-end in an isolated sandbox; my workstation is untouched.
This was massive because without it, the Implementation Loop simply couldn't spin -- the agents had nowhere to put their hands on the app and actually use Handy.
2. The instrumentation
The agents also had to be able to see inside the app. A memory leak in a Tauri application is a multi-process, multi-runtime problem -- the Rust process, the WebKit subprocess, the IPC layer stitching them together -- and no single observation tool sees all of it. You can stare at the Rust files all day and learn nothing; the bug only exists at runtime, while the thing is running, across processes. So I wired Handy up to four observation tools, all recording simultaneously:
and a smaps_rollup sampler for memory usage per process, per memory category
flowchart TB
    subgraph Handy["Handy at runtime"]
        direction LR
        Rust["Rust process"]
        IPC["Tauri IPC layer"]
        WebKit["WebKit subprocess"]
        Memory["Process memory<br/>(by category)"]
    end

    Rust -.observed by.-> U["<b>uftrace</b><br/>every Rust function call"]
    IPC -.observed by.-> S["<b>strace</b><br/>syscalls + IPC payloads"]
    WebKit -.observed by.-> I["<b>WebKit Inspector</b><br/>JavaScript heap"]
    Memory -.observed by.-> SM["<b>smaps_rollup sampler</b><br/>memory by category"]
Four tools, one per layer of Handy's execution surface. None of them sees the whole picture alone.
Four tools, synchronized. Each one sees what the others can't; together, they cover the entire execution surface where allocations could come from. This is The Framework's Multi-Sensory Feedback System adapted for chasing memory leaks in a complex desktop app -- Visual, Auditory, and Tactile senses, instantiated for runtime memory analysis instead of UI rendering.
This was also massive: the Implementation Loop requires that AI agents have digital senses to successfully observe the target -- runtime memory footprint, in this case -- and close the feedback loop. As explained in The Framework, closing the loop is critical to success.
3. Narrowed systematically until only one candidate remained
Here's where the engineering discipline goes full on. Most "AI debugging" starts with a hypothesis and tries to confirm it -- which is just expensive vibe coding with extra steps. I started with the data.
We had eight candidate mechanisms that could explain what we were seeing; five iterative measurements later, we had one.
The smaps sampler localized growth to a specific WebKit subprocess (the recording overlay).
The WebKit heap snapshot diff ruled out JavaScript -- 1.2% of the growth, a rounding error.
The smaps category breakdown ruled out shared libraries -- 100% of growth in private-anonymous pages, i.e., C++ allocations.
uftrace and strace identified the upstream driver: emit_levels firing at 24 Hz, dual-broadcasting events to a hidden overlay subprocess the user never even sees.
This was a constraint-satisfaction problem reduced to one surviving candidate -- and by the time it was, the only intervention left was cutting the event source.
4. Fixed it three ways, tested each piece on its own and together
The fix had three candidate components, each wired to a runtime switch -- an environment variable I could flip on or off without rebuilding the app. Then I ran the same memory test against several configurations: all switches off (does the leak still reproduce? yes), each switch on by itself (what does that one piece contribute?), and all switches on (combined effect). The numbers per configuration told me which pieces were doing work and which weren't pulling their share. One of the three -- throttling the event rate from ~24 Hz to 20 Hz -- had no measurable effect and was decidedly cut from the PR. The other two carried the fix. This was impossible to know without the measurements.
"What were the actual fixes for the bloody memory leak?" he asked, brows furrowed with frustration and anticipation.
Handy has a cool voice visualizer feature (off by default) that bounces about to show microphone input activity. The memory leak lives in this, though it's not as straightforward as it sounds, as the path from mic to visualizer runs through the previously mentioned multi-runtime execution. The actual memory leak lives upstream of Handy in WebKit -- specifically in the recording overlay's WebKit subprocess -- not in Handy's codebase, which means we couldn't fix it directly so we had to be a bit clever in how we mitigated the leak in Handy itself by starving the upstream of the event traffic that drives the leak.
Don't send voice visualizer data when the overlay is turned off. This turned out to be the biggest contributor to the memory leak and, as the overlay is off by default, this fix helps most users. Even when it's off, there's a hidden WebKit subprocess that is still alive, still listening and still leaking (😭).
Cache the overlay-enabled state in an AtomicBool, check it at the top of emit_levels, return early if the overlay is off. For most Linux users, the event source just goes silent. The leak source is starved.
Narrow the way that voice visualizer data are sent when the overlay is turned on. The original implementation was 2 global broadcasts of microphone level events, sent to every webview, twice per audio callback. This was replaced with a targeted emission directly to the overlay which halved the WebKit dispatch work per callback.
It's a quirk of Tauri 2: both AppHandle::emit and WebviewWindow::emit are global broadcasts. Replace the dual call with a single app.emit_to("recording_overlay", "mic-level", levels)
Before the fix:
flowchart LR
    Mic["microphone input<br/>(audio callback ~24 Hz)"] --> EL["emit_levels"]
    EL --> AHE["app_handle.emit<br/>(global broadcast)"]
    EL --> OWE["overlay_window.emit<br/>(also a global broadcast)"]
    AHE --> Overlay["recording_overlay<br/>WebKit subprocess<br/>(hidden when overlay off,<br/>but still alive and listening)"]
    OWE --> Overlay
    AHE --> Others["other webviews"]
    OWE --> Others
    Overlay --> Leak["💥 WebKit C++ allocations<br/>(unbounded growth)"]
After the fix:
flowchart LR
    Mic["microphone input<br/>(audio callback ~24 Hz)"] --> EL["emit_levels"]
    EL --> Check{"AtomicBool check:<br/>is overlay enabled?"}
    Check -->|"no (most Linux users)"| Drop["return early<br/>(no emit, no leak)"]
    Check -->|"yes"| ET["app.emit_to<br/>(recording_overlay only)"]
    ET --> Overlay["recording_overlay<br/>WebKit subprocess"]
    Overlay --> Bounded["✅ WebKit C++ allocations<br/>(bounded)"]
Before: events fanned out to every webview, twice per audio callback, with the hidden overlay still receiving and leaking. After: events are gated on overlay state, and when they do fire, they go straight to the overlay only.
5. Three rounds of adversarial review
Even with all of the good engineering work done thus far, before a single claim went into the PR description, agents were explicitly tasked to try to break the analysis. Are you actually measuring what you think you're measuring? Is that a sustained leak or just warmup? Does the data distinguish your hypothesis from alternatives?
This three-stage adversarial review puts the artifact through:
a claim check (every assertion classified by evidence type: measured, verified, inferred, assumed),
then three reviewer subagents role-playing the audience (the Handy maintainer, a Tauri developer, a WebKit memory expert) with no investigation context,
then two cold reviewers with zero memory of prior drafts.
Agents in each round have a clear objective: tear it apart. Find anything wrong, misleading, or that wastes a maintainer's time. The PR doesn't bullshit because it's been stress-tested by independent agents whose job was to find the bullshit. This was particularly important as I didn't have language familiarity to fallback on as I reviewed the PR.
6. The meatbag-in-the-loop soak
Controlled captures are great for proving things in a lab. But the fix had to run on my machine, in production, with days of normal use, before I'd call it done. Memory leaks accumulate over hours and days, not minutes -- and the bug that initially took me down had occurred after 36 hours of continuous use. So I ran the patched build for myself, in actual daily work, for six days straight (well, precisely, it was 5 days, 18.5 hours) across seven separate launches, while a tiny shell script polled every 30 seconds and dumped per-process memory readings into a CSV. The data shows the fix worked. And honestly, the more important validation: I -- as a human, daily user of this tool -- am writing this very article using the patched build right now. If it had broken something, I'd have noticed, and I'd have the data to identify exactly what had gone wrong. Buuuuuuuuuuut it's working brilliantly, due to the application of the engineering discipline prescribed in The Framework!
What's next, then?
With all of this real software engineering bolstering it, I submitted the pull request to fix the memory leak. Now we play the waiting game ...
You, too, can be an AI agents ninja!
Are you struggling with bugs in daily driver open source tools that you love to use? Lift this approach. Fix them. Tell me how it went!
I literally had my AI agents write-up the methodology and instrumentation so that yours could learn and apply them. Give those to them, along with this article, and let them rip.
Made it this far? Well done, you. Now go and transcend vibe slop with all you've read!
corey@gallon.me:~$ tail -f /writingAttach to the stream.An email when I have something worth sending.Replies encouraged!

 Courtesy of The Cure for the Vibe Coding Hangover